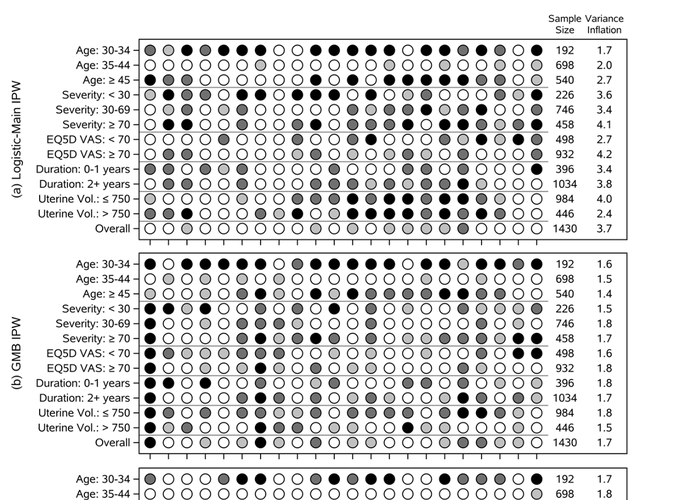
Abstract
A common goal in comparative effectiveness research is to estimate treatment effects on prespecified subpopulations of patients. Though widely used in medical research, causal inference methods for such subgroup analysis (SGA) remain underdeveloped, particularly in observational studies. In this article, we develop a suite of analytical methods and visualization tools for causal SGA. First, we introduce the estimand of subgroup weighted average treatment effect and provide the corresponding propensity score weighting estimator. We show that balancing covariates within a subgroup bounds the bias of the estimator of subgroup causal effects. Second, we propose to use the overlap weighting (OW) method to achieve exact balance within subgroups. We further propose a method that combines OW and LASSO, to balance the bias-variance tradeoff in SGA. Finally, we design a new diagnostic graph—the Connect-S plot—for visualizing the subgroup covariate balance. Extensive simulation studies are presented to compare the proposed method with several existing methods. We apply the proposed methods to the patient-centered results for uterine fibroids (COMPARE-UF) registry data to evaluate alternative management options for uterine fibroids for relief of symptoms and quality of life.